Since writing the Natvis visualizers for Boost.Unordered, I’ve been thinking about how to test them. So far, I’ve only written semi-automatic testing. Run the “visualizer_tests.cpp” file in Visual Studio, break on the label called “break_here”, then inspect the Locals window. Since I already set up the code and checked it in, there’s no need to modify.
But this is still too manual for my liking. I want the CI to fail if I accidentally break the visualizers. Right now, I only know there’s something wrong if I check with my own eyes, or if someone files a bug report. To me, this isn’t good enough. It’s too much of a maintenance burden.
This article dives into what I’ve done so far in pursuit of automated Natvis testing, and ultimately concludes with why I think we’re stuck with manual testing for now. That said, once I can implement automated testing, I’ll hit the ground running.
I have previously written 2 articles, here and here, showing some techniques I used to implement the Natvis visualizations for Boost.Unordered. You don’t need to read those articles to understand this one, but they are there in case you are interested.
This work has been sponsored by The C++ Alliance.
What is Natvis again?
In short, a “.natvis” file is an XML file that the Visual Studio debugger uses to display types more nicely. A “.natvis” file, specifically “STL.natvis”, is the reason why your std::string shows up as "abc" in the Locals/Autos/Watch window, instead of something like {_Mypair={_Myval2={_Bx=... _Mysize=3 _Myres=15 } } }. The latter more closely represents the class structure of std::string, but that shouldn’t be relevant to you or me. We only care about which characters are in our string.
Natvis gives us the tools to tell Visual Studio exactly how to display our types. The official documentation for Natvis is at this page. In my previous Natvis articles (here and here), I go into detail about how I used Natvis, with some techniques I hadn’t previously encountered.
Now that this is out of the way, let’s talk about testing it.
Debugging from the command line
Visual Studio is a GUI, so how do we access the debugger output in an automated way? We can boot up Visual Studio automatically, then use simulated keyboard input to build the code, run it, and copy the debugger output contents from one of the debugging windows. Does this work in practice? I’m sure I can quickly write an AutoHotkey script to do this, or even take some time and methodically write a Powershell script, but ultimately this is a flaky situation.
Unlike a command line interface, we can’t wait on a previous command to finish executing before beginning the next command. For example, if we send the simulated keyboard input of “Ctrl+F7” to compile the code, we need to sleep in the script until the build is finished. How long does that take? How do we stop the script if the build fails? Or if any other step fails? I think trying to automate the GUI is more work than it’s worth, and it creates a whole other maintenance burden.
Funny enough, I had a glimmer of hope when I discovered devenv /DebugExe. I assumed this would give us access to the Visual Studio (aka “devenv”) debugger from the command line. But I was wrong. Running this command just opens the Visual Studio GUI, so it doesn’t help.
Then I remembered that WinDbg exists. From WinDbg’s Wikipedia article at this current time of writing:
Like the Visual Studio Debugger, WinDbg has a graphical user interface (GUI), but is more powerful and has little else in common.
This sounds like it’s exactly what we need, especially since there are ways to use WinDbg as a CLI. Quoting the Wikipedia article again:
The WinDBG Debugger Engine is the common debugging back-end between WinDbg and command line debugger front-ends like KD, CDB, and NTSD. Most commands can be used as is with all the included debugger front-ends.
Between all the options, it looks like CDB (the “Microsoft Console Debugger”) is our best bet. The documentation on WinDbg is quite extensive, so we should have no problem finding what we need.
Aside: Getting WinDbg and CDB
Please skip this section if you don’t care about running any of these tools on your own machine.
Initially, I didn’t have WinDbg or any of its CLIs. Currently, on my machine, CDB is located at “C:\Program Files (x86)\Windows Kits\10\Debuggers\x64\cdb.exe”. If you don’t have this “Debuggers” folder, read on.
To get WinDbg and its CLIs, you need to install the Windows SDK. I already had the Windows SDK, so I did the following steps.
- Go to “Add or Remove Programs” on your machine (or the equivalent if they rename it in the future)
- You should have a program called “Windows Software Development Kit - Windows {version-number}”
- On this program, click “Modify”
- In the new pop-up window, select “Change”, then add the “Debugging Tools for Windows”, then “Change”
After loading and installation, you should have that “Debuggers” folder from the file path I showed above. Otherwise, I’ll refund what you paid to read this article.
Setting up the debugger just how I want it
Here’s a nice find. CDB has a capability similar to GDB’s “gdbinit” file. If we place a file called “ntsd.ini” in the same directory that we’re running CDB from, then this file is used as a list of commands to run.
For the “meta-commands”, I’m using the following. Note, the meta-commands are regarding the debugger’s own properties and state, and they begin with a dot. All regular commands are regarding the program being debugged.
.sympath [exe_directory] to load the symbols in the pdb file. This may load automatically since the exe is in the same directory, but it may not, and I’d rather have the redundancy..nvload path\to\boost\libs\unordered\extra\boost_unordered.natvis to load the Natvis file.
Next, for the regular commands, this is what I’m using. Note, previously I had a goto label in the test code called break_here, but I need to change this to a function to be able to break on it. We could use line numbers, but I’d rather we be resistant to code edits that cause the line numbers to change.
bm visualization_tests!break_here to break inside the function break_here(), which is called from within the function we want to test.g to run the program until a break point. After running this command, we end up inside break_here().gu to run until the end of the current function. This is effectively a “step out” command, that puts us in the function we want to test.
This is the “nstd.ini” file I have currently, filling in the missing pieces for my own machine. Every time I run cdb.exe path\to\visualization_tests.exe, it runs these commands in order. Then I’m at exactly the place I need to be in the program in order to test how the variables are displayed.
.sympath [exe_directory]
.nvload path\to\boost\libs\unordered\extra\boost_unordered.natvis
bm visualization_tests!break_here
g
gu
Testing the displayed variables
My plan is this.
- Grab the displayed output of each of the variables
- Send the console output to another program for validation
- ???
- Profit
The WinDbg dx command works for our purposes. From the documentation:
The dx command displays a C++ expression using the Natvis extension model.
Perfect.
The file “visualization_tests.cpp” has a variable for each of the kinds of containers in Boost.Unordered. The boost::unordered_set is called fca_set, so let’s try that one. This is what it looks like in Visual Studio.
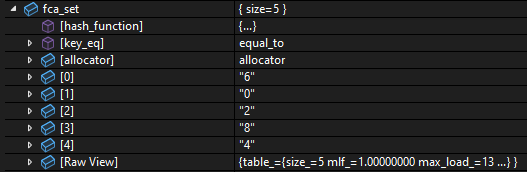
And this is what happens in CDB. I added ... in place of the actual template parameters, to clear away the visual noise. In reality, the entire type name is displayed here.
0:000> dx fca_set
fca_set          : { size=0x5 } [Type: boost::unordered::unordered_set<...>]
    [<Raw View>]     [Type: boost::unordered::unordered_set<...>]
    [bucket_count]   : 0xd [Type: unsigned __int64]
    [max_load_factor] : 1.000000 [Type: float]
    [allocator]      : allocator [Type: node_allocator_type]
    [hash_function]  [Type: boost::hash<...>]
    [key_eq]         : equal_to [Type: std::equal_to<...>]
I see 2 major differences between the Visual Studio and the CDB displays.
- CDB shows
[bucket_count] and [max_load_factor], but these are not present in Visual Studio
- Visual Studio shows all the elements, but the elements are missing from CDB
I thought I set up something improperly. However, as it turns out, the Visual Studio debugger and WinDbg have independent implementations of Natvis.
This is something I learned recently. It seems like Visual Studio created Natvis for VS 2012, and WinDbg started adding support for Natvis with Windows 10 in 2015, with commands like dx and .nvload. I assumed these would use the same implementation in the backend, but this seems not to be the case.
Next I’ll describe the problems in more detail.
We need IncludeView and ExcludeView
I’ll start with this point I mentioned above.
1 . CDB shows [bucket_count] and [max_load_factor], but these are not present in Visual Studio
Skipping some investigation steps, it looks like WinDbg does not currently have proper support for Natvis IncludeView and ExcludeView attributes. Here is a quick example of how these attributes work when placed on <Item> elements. Take the following Natvis <Type> for my class S.
<Type Name="S">
    <DisplayString>S</DisplayString>
    <Expand>
        <Item Name="[foo]">1</Item>
        <Item Name="[bar]" ExcludeView="simple">2</Item>
        <Item Name="[baz]" IncludeView="detailed">3</Item>
    </Expand>
</Type>
Let’s assume I have an object s of type S. In the debugger:
s will display [foo] and [bar] by default, because [baz] will only be shown in the “detailed” views,view(simple) will display only [foo], because [bar] is excluded from the “simple” views,view(detailed) will display [foo], [bar], and [baz]
The Boost.Unordered containers make use of IncludeView and ExcludeView. In our case, [bucket_count] and [max_load_factor] have the attribute IncludeView="detailed", but WinDbg displays those items regardless. You can see this difference for yourself if you display a std::unordered_map, since the standard unordered containers do a similar thing in their Natvis. After all, I modeled the Boost.Unordered Natvis implementation after the STL implementation.
We need <Intrinsic> overloaded by substitution failure
My other point mentioned above was this.
2 . Visual Studio shows all the elements, but the elements are missing from CDB
This is actually coming from a different problem in the WinDbg Natvis support. Previously in my second Natvis article, I used this technique.
I’ll write a pair of <Intrinsic> elements using Optional="true", so that one of them always fails to parse and the other succeeds.
An <Intrinsic> element is a function defined within Natvis. In the Natvis spec, there is a boolean attribute called Optional that allows an <Intrinsic> to be silently removed if it encounters a parse error. When the happens, the entire <Type> is still valid, but it no longer has that particular <Intrinsic>.
In that previous article, I showed a pair of optional intrinsics where one of them is valid and the other is invalid, depending on the circumstances. In every case, there is exactly 1 semantically valid intrinsic. There is no need for overload resolution, since the Optional="true" attribute removed the invalid intrinsics. As I also said in the previous article:
this is very similar to SFINAE in C++
This is a technique I require in order to support fancy pointers in the Natvis. Unfortunately, it looks like WinDbg’s Natvis support doesn’t allow for this kind of SFINAE overloading at the moment.
I iterate over the container’s elements in Natvis inside a <CustomListItems> element. When the intrinsic to_address() gets called the first time, it causes a parse error, and the entire execution of the <CustomListItems> is stopped. Therefore, the elements aren’t displayed.
Present situation
I have filed 2 reports with WinDbg for these 2 missing features I need for the Boost.Unordered Natvis, linked here and here. Until these features are supported, I don’t think it’s possible to write automated testing for Boost.Unordered’s Natvis.
Regardless, I want to emphasize, these visualizers work properly in Visual Studio. Right now, if you use Boost.Unordered with MSVC, you can easily view the contents of the containers as if they were STL containers. My only issue is, the visualizers may stop working properly, and I won’t know until I check manually.
Once these features are eventually supported in WinDbg, I’ll resume this effort. I want to see an ecosystem of libraries with debugger visualization support, where we can be confident in their correctness. We’ll get there.